Machine Learning.
Data Visualization.
Supervision Engine.
Our AI-Powered Solutions
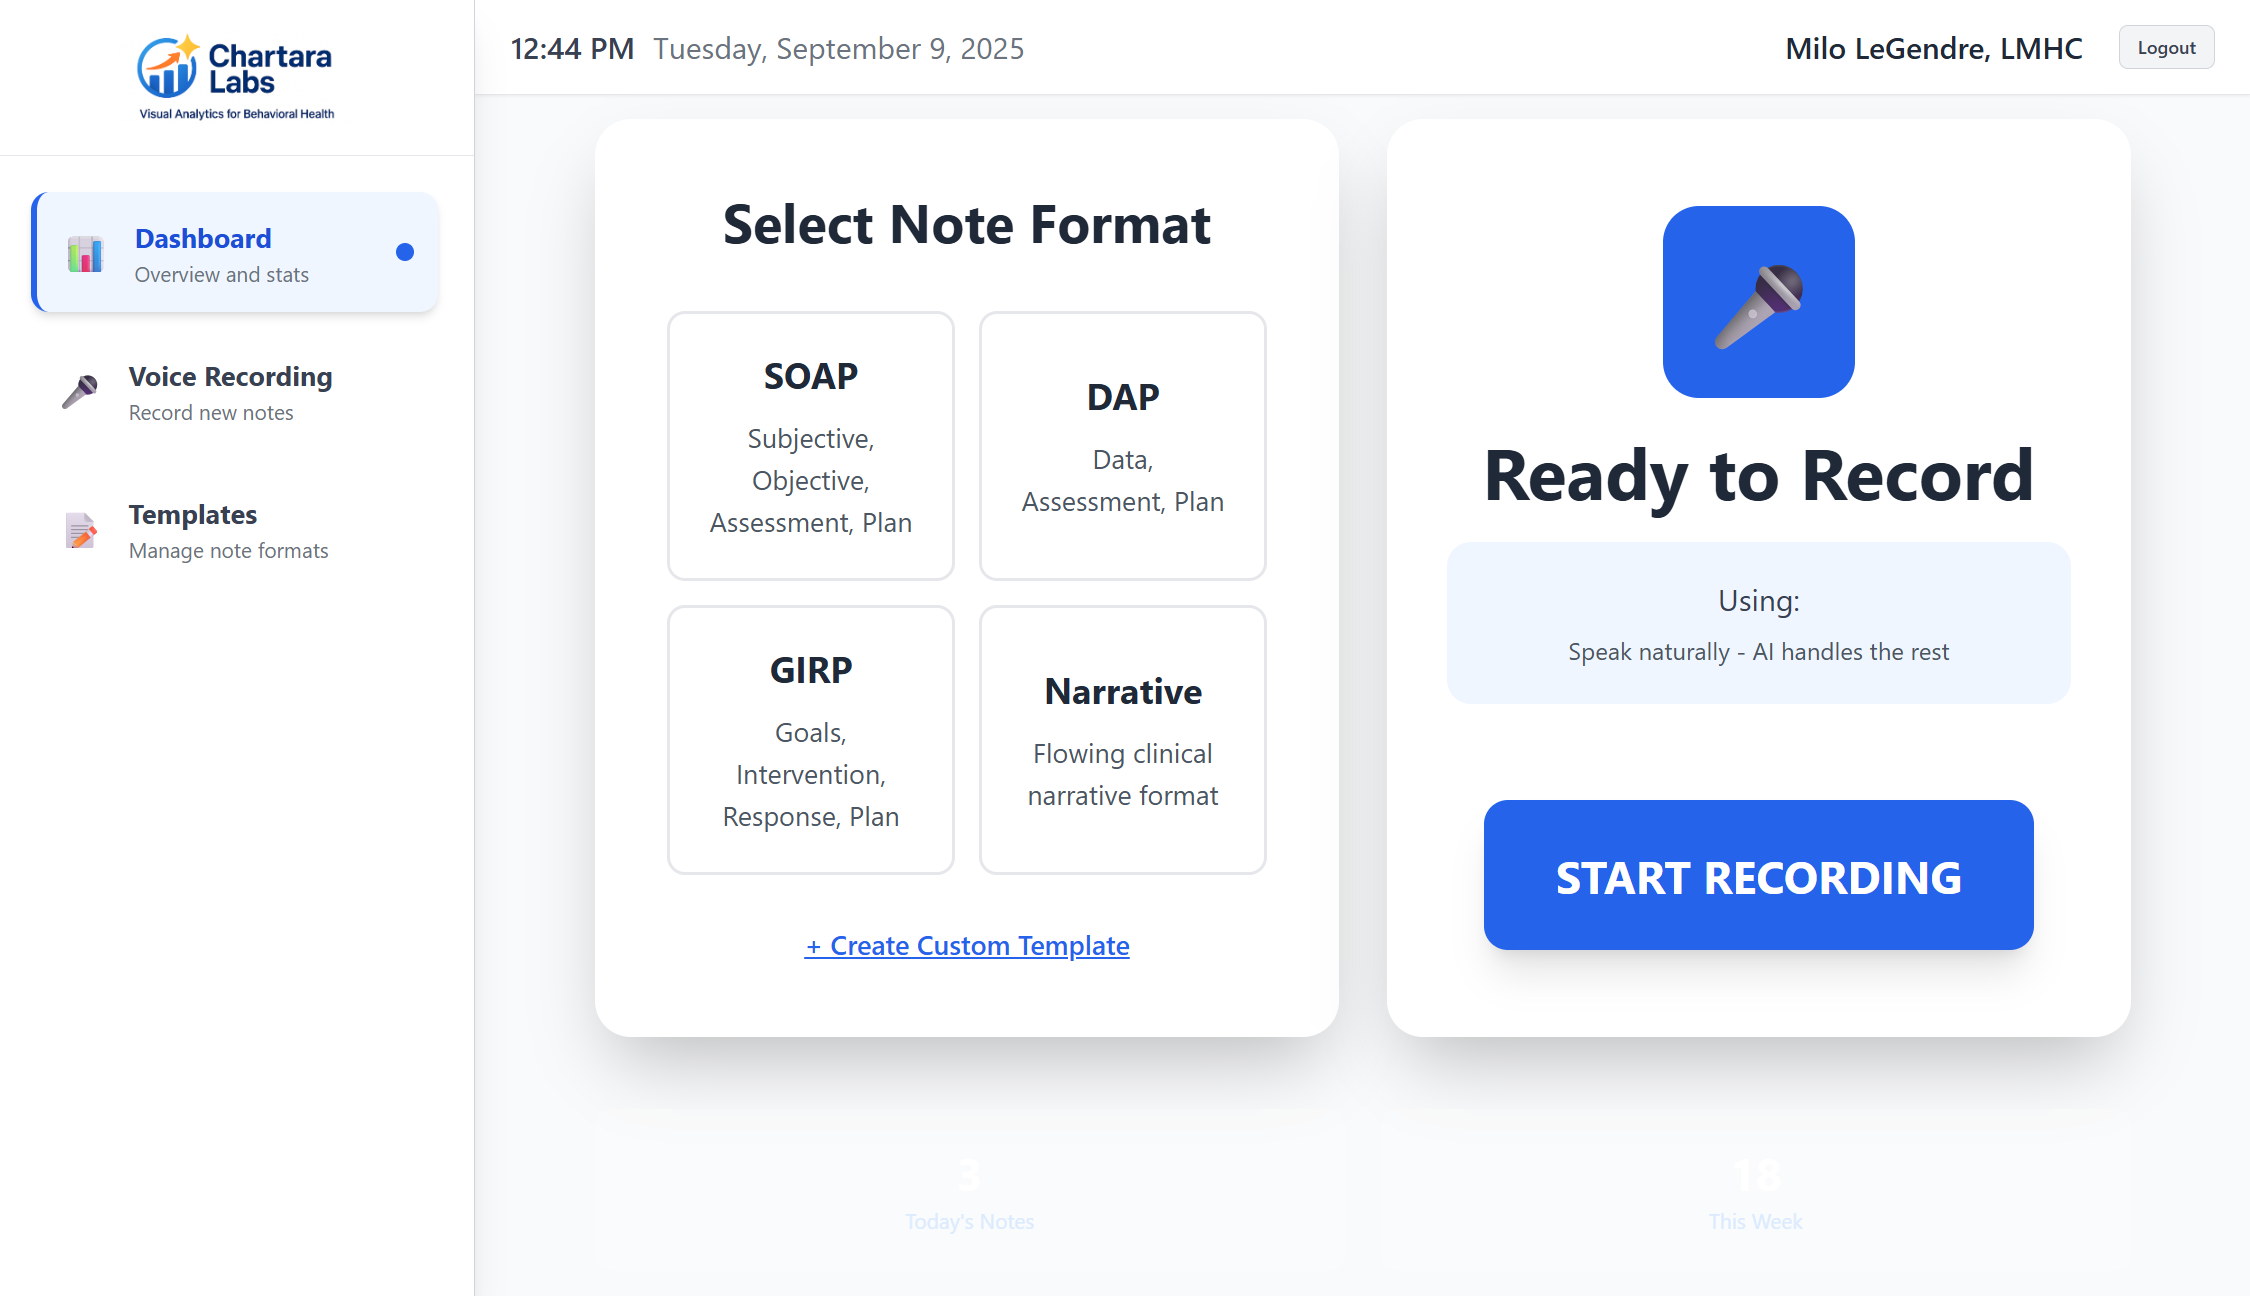
Chartara Notes
Create professional clinical documentation by simply speaking about your sessions. Chartara Notes adapts to YOUR workflow - build custom templates with your exact section headings, or use proven formats like SOAP and DAP. Our AI understands therapeutic language and intelligently transforms your natural speech into polished, HIPAA-compliant notes in seconds. Stop typing for 30 minutes. Start speaking for 60 seconds.
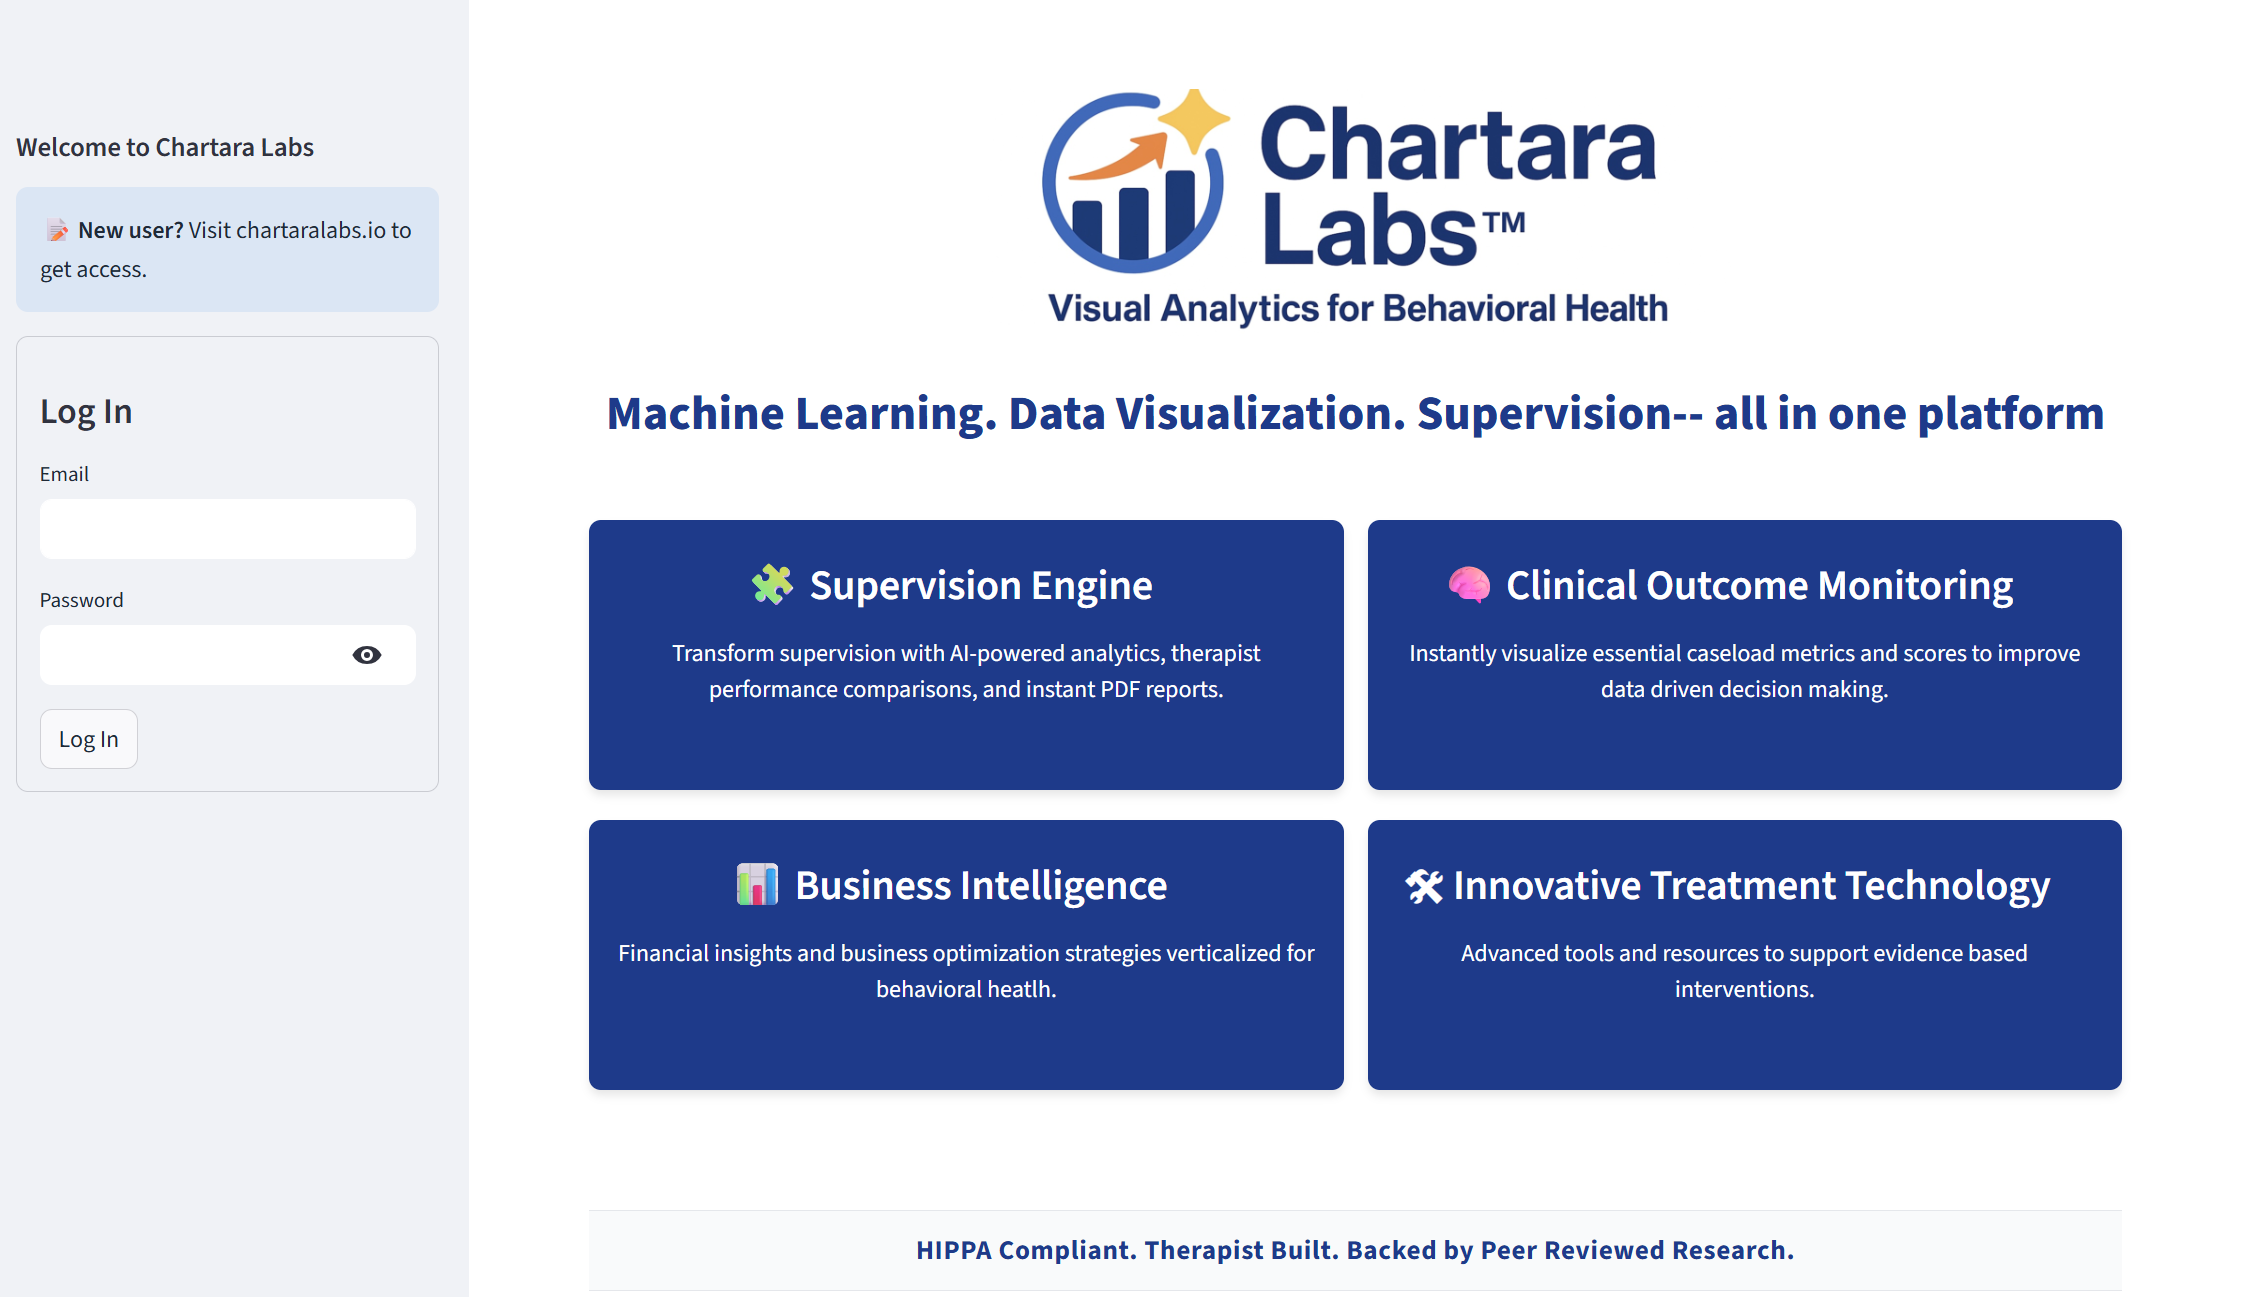
Chartara Labs Essential Practice
Complete AI-powered visual analytics platform with comprehensive chart library, PDF reporting, and intelligent business insights for behavioral health practices.
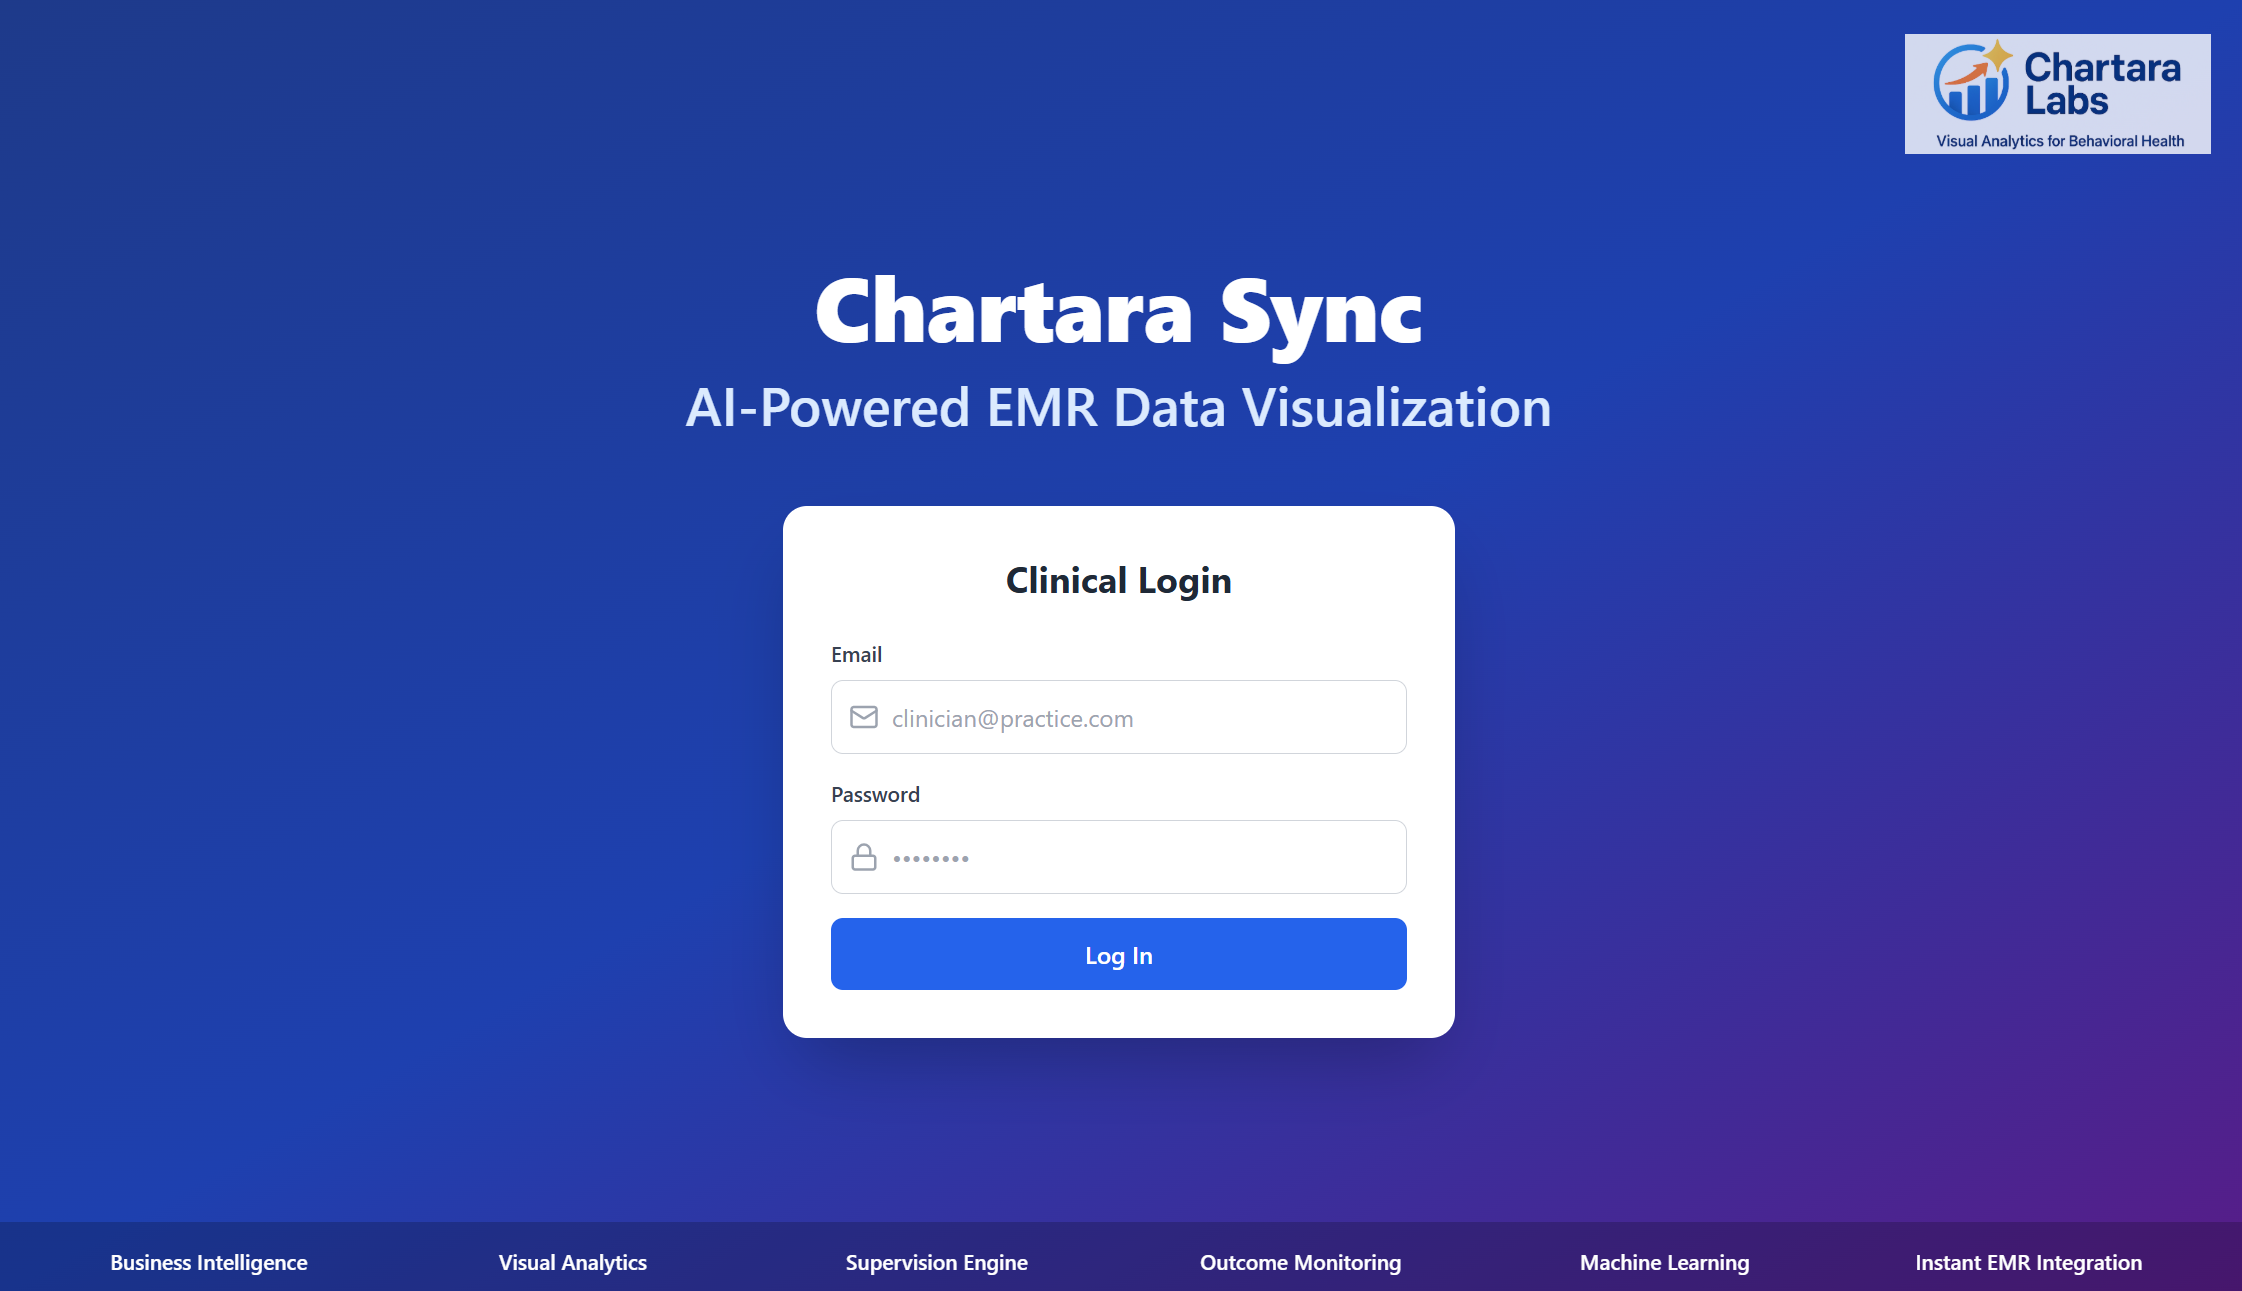
Chartara Sync
A multi-modal AI visual analytics pipeline that seamlessly connects with any EMR. Chartara Sync transforms raw clinical and operational data into intuitive dashboards, reshaping therapist, supervisor, and administrator workflows for routine outcome monitoring and reporting. Built for organizations that demand precision, adaptability, and real-time insight. Chartara Sync is a more advanced, automated version of the Essential Practice subscription that works without manual data entry. You get data visualizations, machine learning analytics, and PDF reporting — instantly, at the click of a button. Visual analytics are tailored to your unique practice needs.
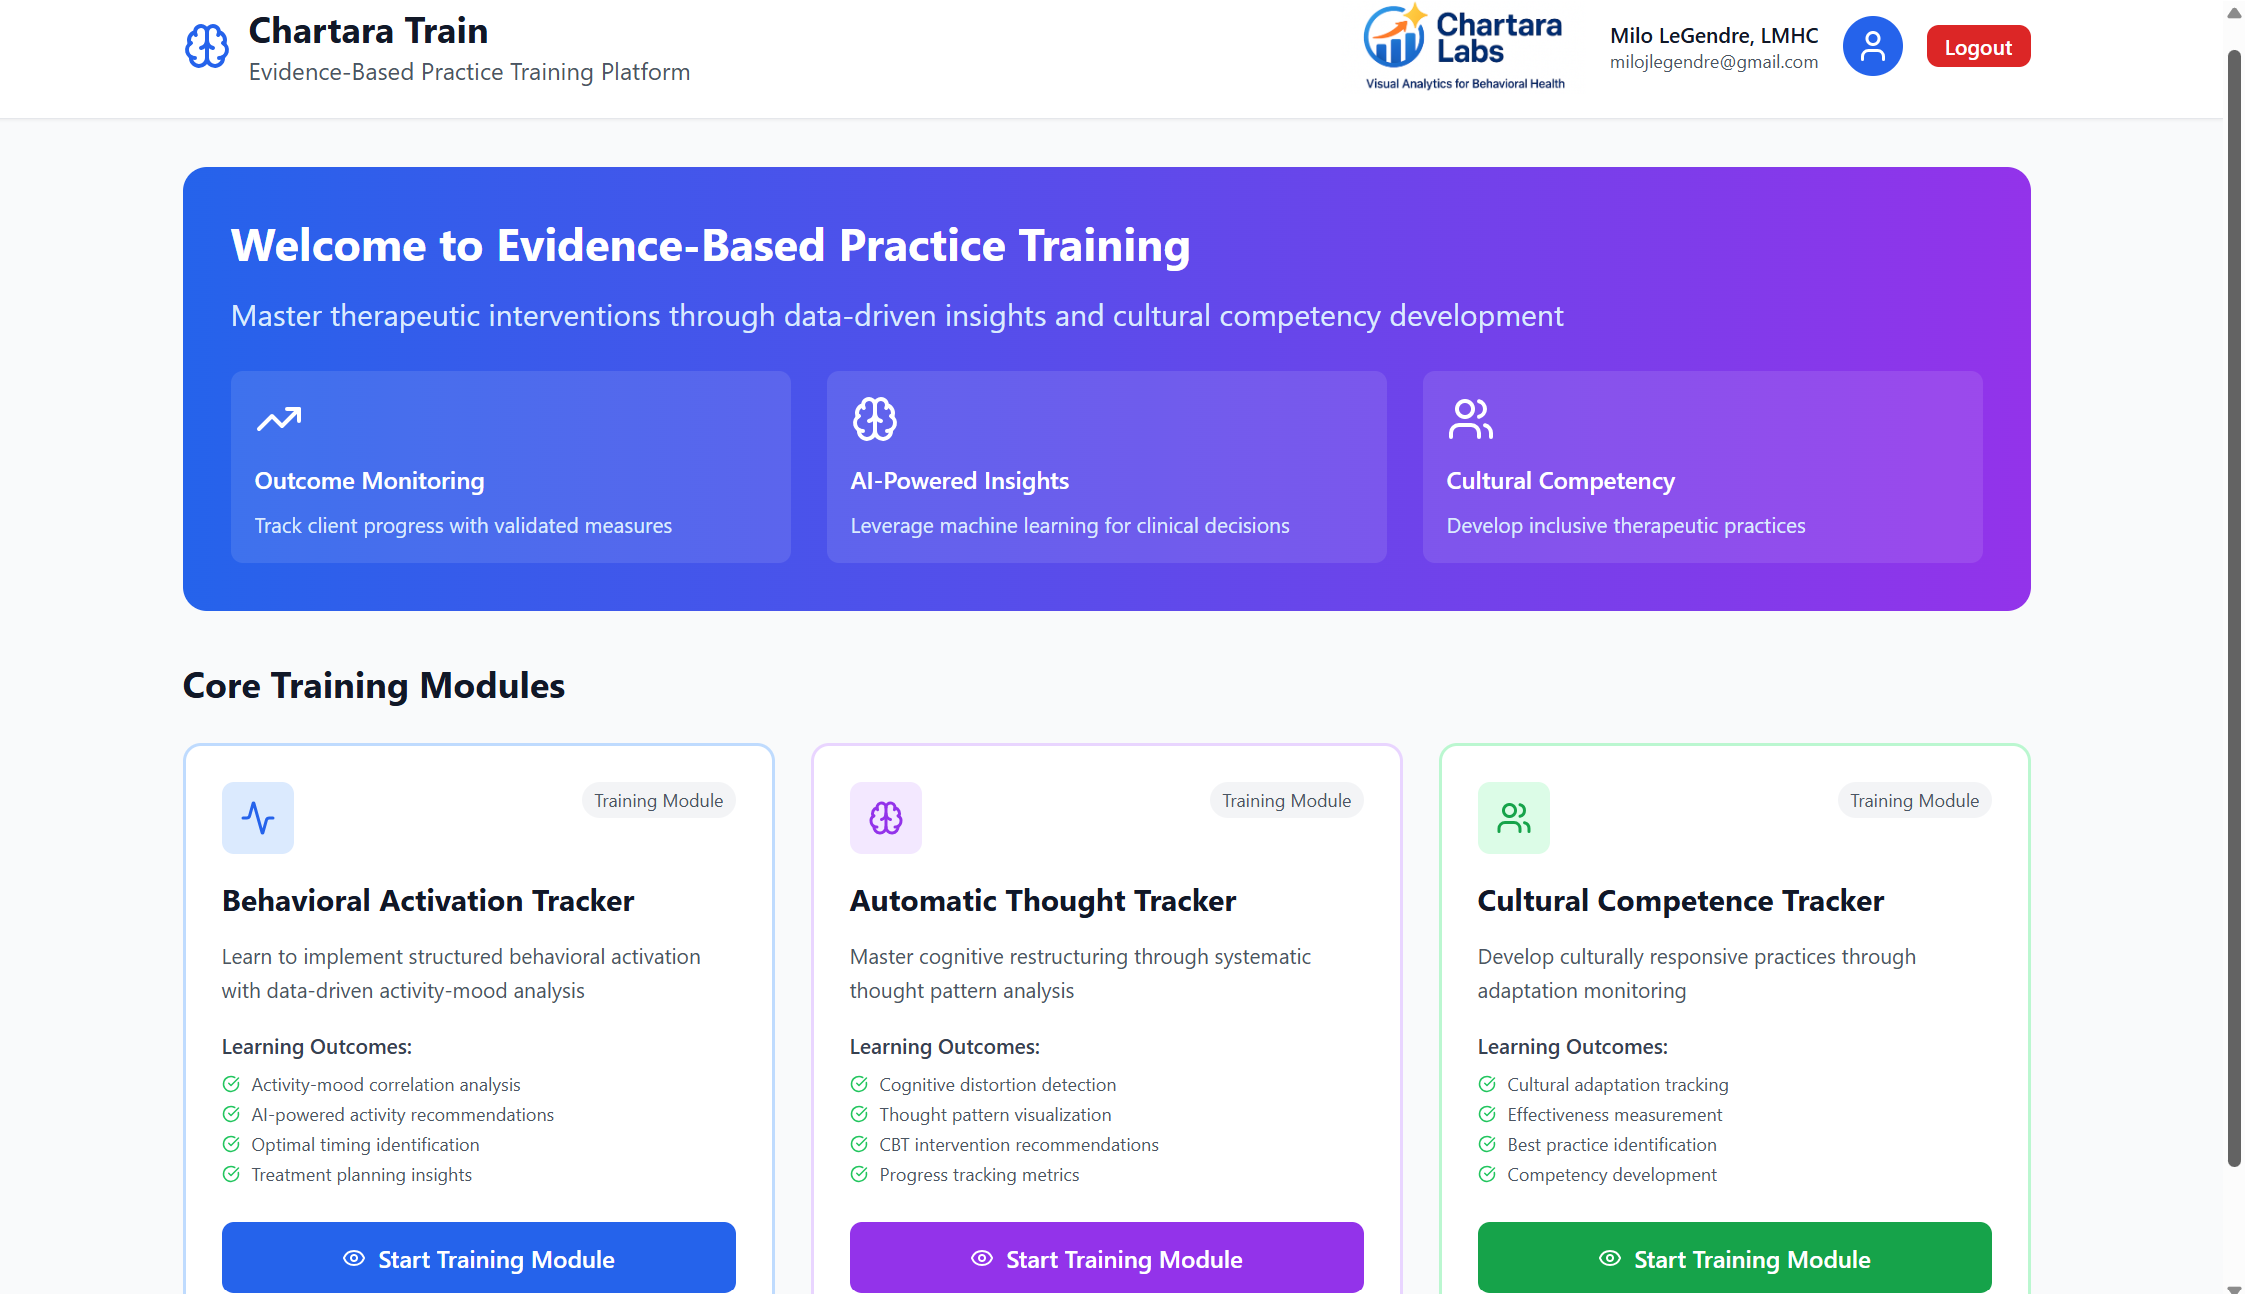
Chartara Train
Master evidence-based interventions through AI-powered analytics for behavioral activation, cognitive restructuring, and cultural competence—with outcome tracking that strengthens funding opportunities and demonstrates program effectiveness.
Core Problems We Solve
Supervision Guesswork
Generate instant PDF performance reports comparing therapists, outcomes, client attendance show rates, comprehensive caseload analytics, and more. Instant PDF report for every chart: including the colored data visualization and the analytics section. Evidence-based supervision in seconds, not hours.
Data Chaos
Therapists are in over their heads in data. And it's hard to make sense of it. Stop navigating through lots of screens in your EMR, trying to interpret unhelpful, disorganized data. Use Chartara Labs to CENTRALIZE YOUR DATA and GENERATE INSTANT VISUALIZATIONS that bring your caseload to life. Make your data ACTIONABLE.
Outcome Blindness
Machine learning analytics reveal which clients are improving, which need intervention, and what treatment approaches work best for your practice. Each data visualization is combined with a comprehensive analytics section- dynamically adapted to your unique caseload. Machine learning algorithms include descriptive, prescriptive, and predictive analytics.
Business Mystery
Intelligent forecasting and analysis learns your practice patterns and predicts growth opportunities, seasonal trends, and financial optimization strategies. Business Intelligence analytics are included across charts. All vertically integrated for Behavioral Health.
What Sets Us Apart
What We Are
What We Are NOT
Frequently Asked Questions
Chartara Train
Chartara Train is a sophisticated analytics platform that empowers behavioral health professionals to master evidence-based interventions through data-driven clinical training. By combining structured data collection with advanced AI analytics, Chartara Train provides therapists with professional-grade insights, treatment planning tools, and outcome monitoring capabilities across three specialized clinical domains.
Core Platform Features
Intelligent Data Processing
Upload clinical tracking data via web forms or structured templates and receive comprehensive AI-powered analysis within seconds. Our machine learning algorithms identify patterns, correlations, and treatment opportunities that would take hours to discover manually. Client mobile app for self-tracking coming soon.
Professional Visualization
Interactive charts transform complex clinical data into clear, actionable visualizations. Track progress over time, compare intervention effectiveness, and identify optimal treatment strategies through intuitive graphical representations.
Clinical Documentation
Generate professional PDF reports combining analytics, visualizations, and evidence-based recommendations. Perfect for treatment planning, supervision, case consultation, and clinical documentation requirements.
HIPAA-Compliant Architecture
Built on Azure's enterprise-grade infrastructure with comprehensive Business Associate Agreement coverage. All data processing occurs within HIPAA-compliant cloud services, ensuring maximum security for protected health information.
Three Specialized Training Modules
1. Behavioral Activation Tracker
Master structured behavioral activation therapy through systematic activity-mood analysis. This module helps clinicians identify which activities provide optimal therapeutic benefit for each client through:
- Activity-satisfaction correlation analysis with ranking algorithms
- Temporal pattern recognition (optimal timing, duration, frequency)
- Category-based effectiveness comparison
- AI-generated activity recommendations based on satisfaction metrics
- Progress tracking with daily trend analysis
- Treatment planning integration with session-by-session guidance
Clinical Applications: Depression treatment, anxiety management, behavioral engagement strategies, values-based action planning, relapse prevention
2. Automatic Thought Tracker
Develop expertise in cognitive restructuring through systematic thought pattern analysis. This CBT-focused module provides comprehensive cognitive distortion detection and intervention planning:
- Automated cognitive distortion categorization across 15+ distortion types
- Frequency analysis identifying primary thought patterns
- Evidence-based CBT intervention matching for each distortion category
- Thought-emotion-behavior correlation tracking
- Progress monitoring showing distortion reduction over time
- Treatment planning with Socratic questioning frameworks
Clinical Applications: Cognitive behavioral therapy, anxiety disorders, depression, OCD, PTSD, cognitive restructuring interventions
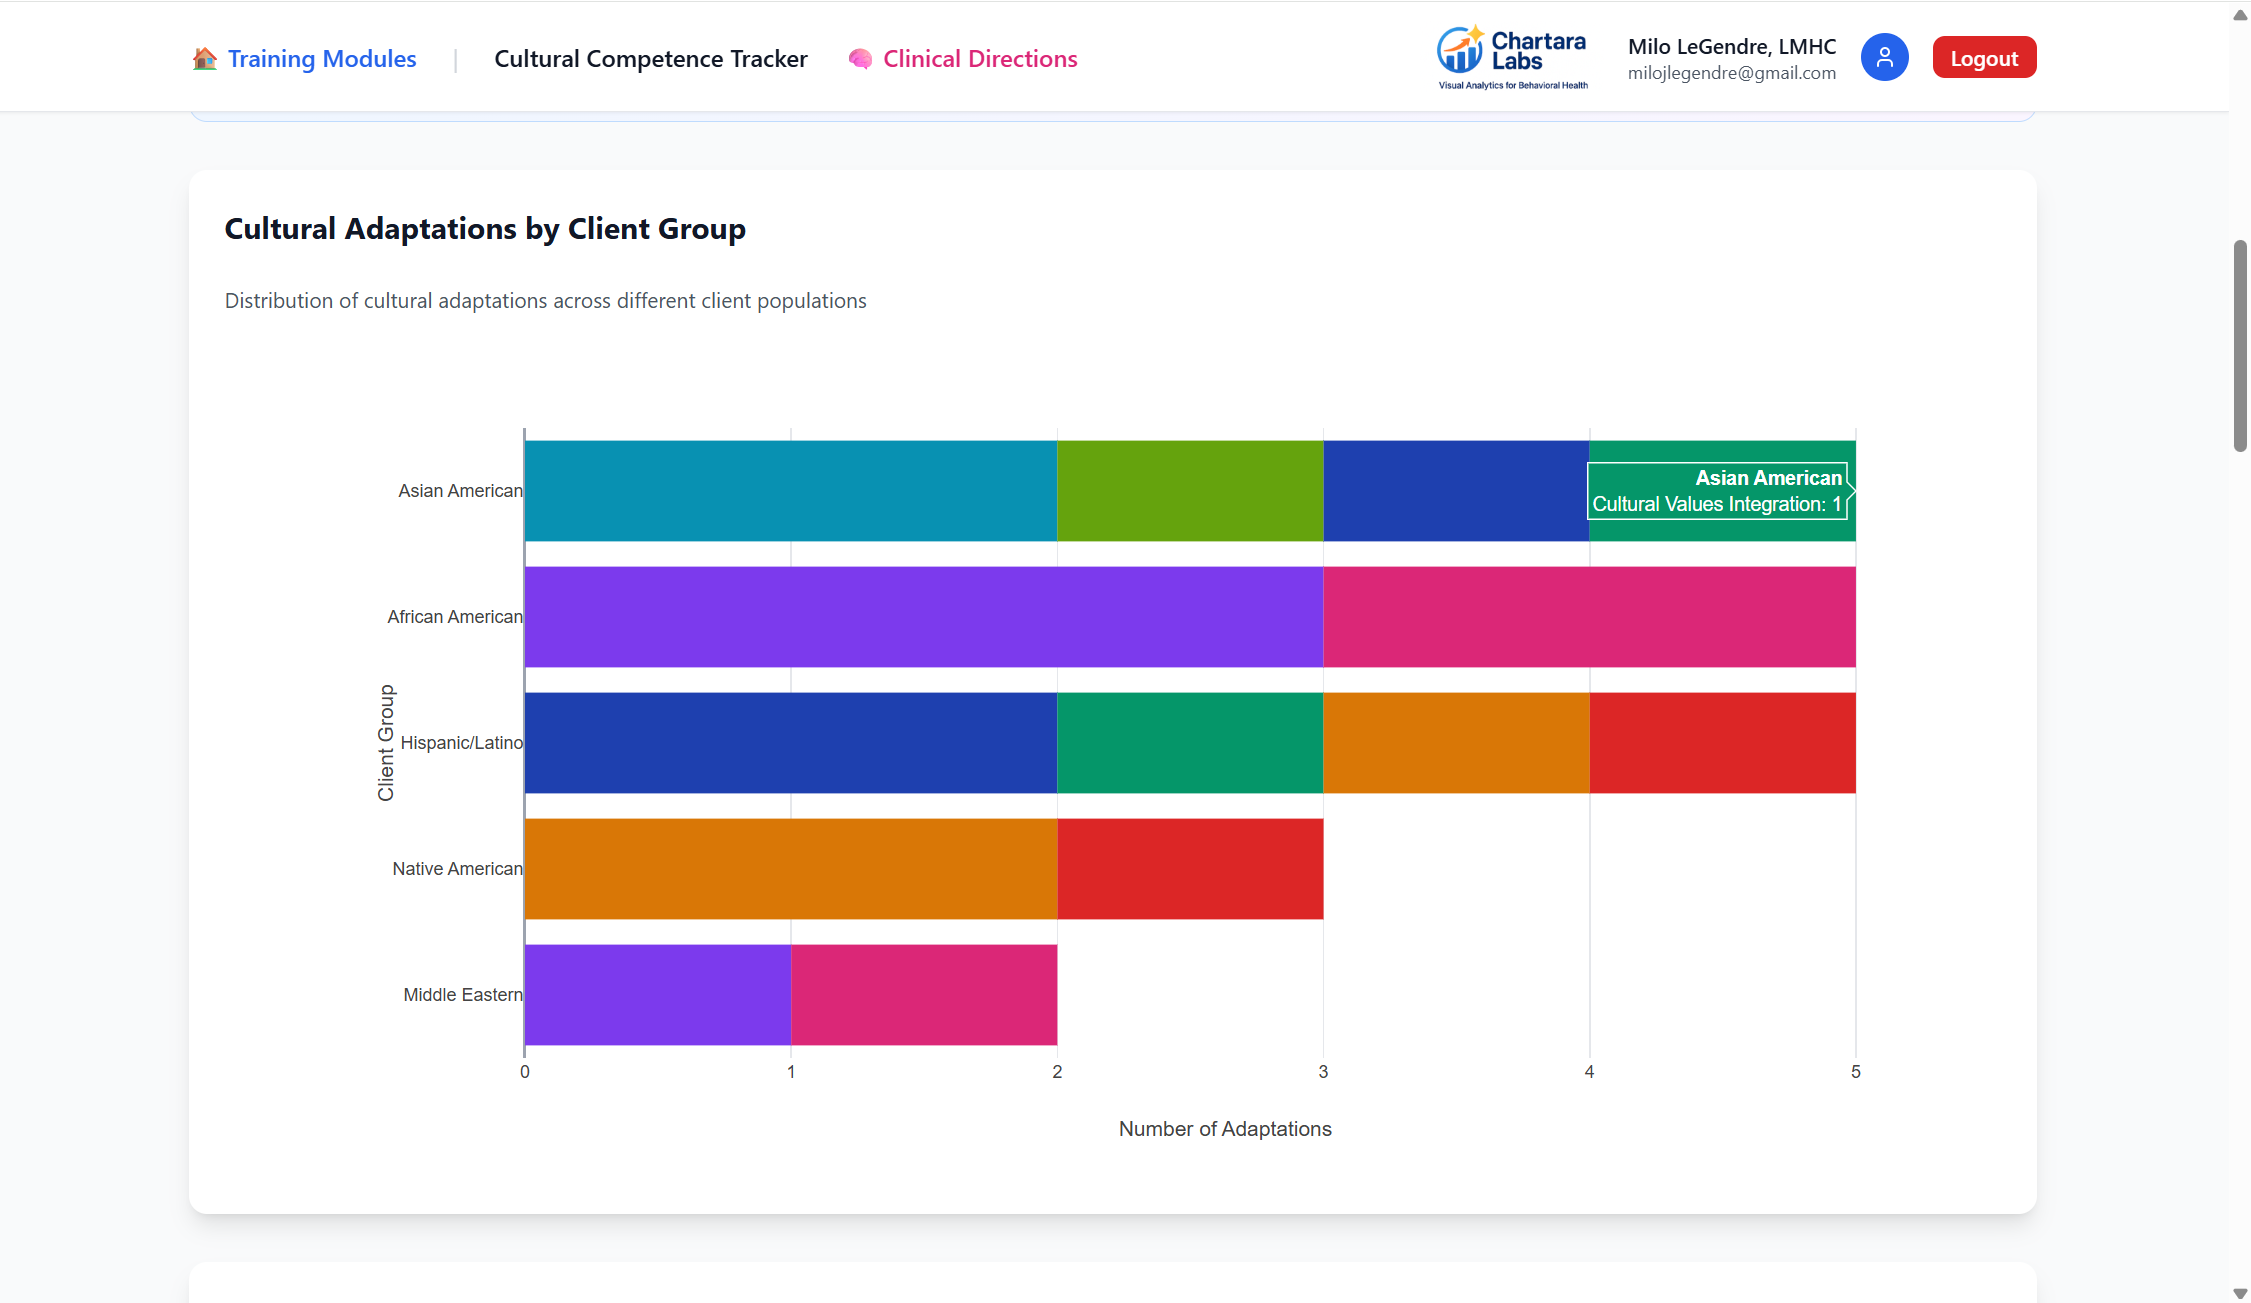
3. Cultural Competence Tracker
Build culturally responsive therapeutic skills through systematic adaptation monitoring. This novel module helps clinicians develop and refine cultural competency through evidence-based practice:
- Cultural adaptation strategy documentation and tracking via web forms
- Effectiveness measurement across diverse client populations
- Best practice identification through engagement metrics
- Competency level assessment (Beginning → Developing → Advanced)
- Evidence-based cultural adaptation frameworks
- Professional development pathway recommendations
Clinical Applications: Multicultural counseling, cultural formulation, EBP adaptation for diverse populations, supervision and training, cultural humility development
Supporting Outcome-Based Funding Models
Administrative Excellence
Chartara Train provides administrators with clear, data-driven insights into which culturally adapted evidence-based interventions are achieving optimal outcomes across diverse client populations. This transparency enables strategic resource allocation and program development based on proven effectiveness metrics.
Therapist Engagement
The platform naturally encourages therapists to apply evidence-based interventions by making the clinical benefits immediately visible through real-time analytics. This data-driven feedback loop enhances treatment fidelity and promotes consistent application of best practices.
Leadership Empowerment
Clinical directors and first-level leaders gain powerful tools to enhance organizational accountability. The platform's comprehensive tracking and reporting capabilities make it easy to demonstrate program effectiveness, identify areas for improvement, and maintain high standards of care delivery.
🎯 Funding Opportunities
When organizations can demonstrate measurable outcomes from cultural competence initiatives and evidence-based interventions, they significantly strengthen their position for grant applications and funding opportunities. Chartara Train provides the robust data foundation needed to showcase program impact, client improvement metrics, and return on investment—key factors that funding bodies prioritize when evaluating behavioral health programs.
Chartara Sync
A multi-modal AI visual analytics pipeline that seamlessly connects with any EMR. Chartara Sync transforms raw clinical and operational data into intuitive dashboards, reshaping therapist, supervisor, and administrator workflows for routine outcome monitoring and reporting. Built for organizations that demand precision, adaptability, and real-time insight.
Chartara Sync is a more advanced, automated version of the Essential Practice subscription that works without manual data entry. You get data visualizations, machine learning analytics, and PDF reporting — instantly, at the click of a button. Visual analytics are tailored to your unique practice needs.
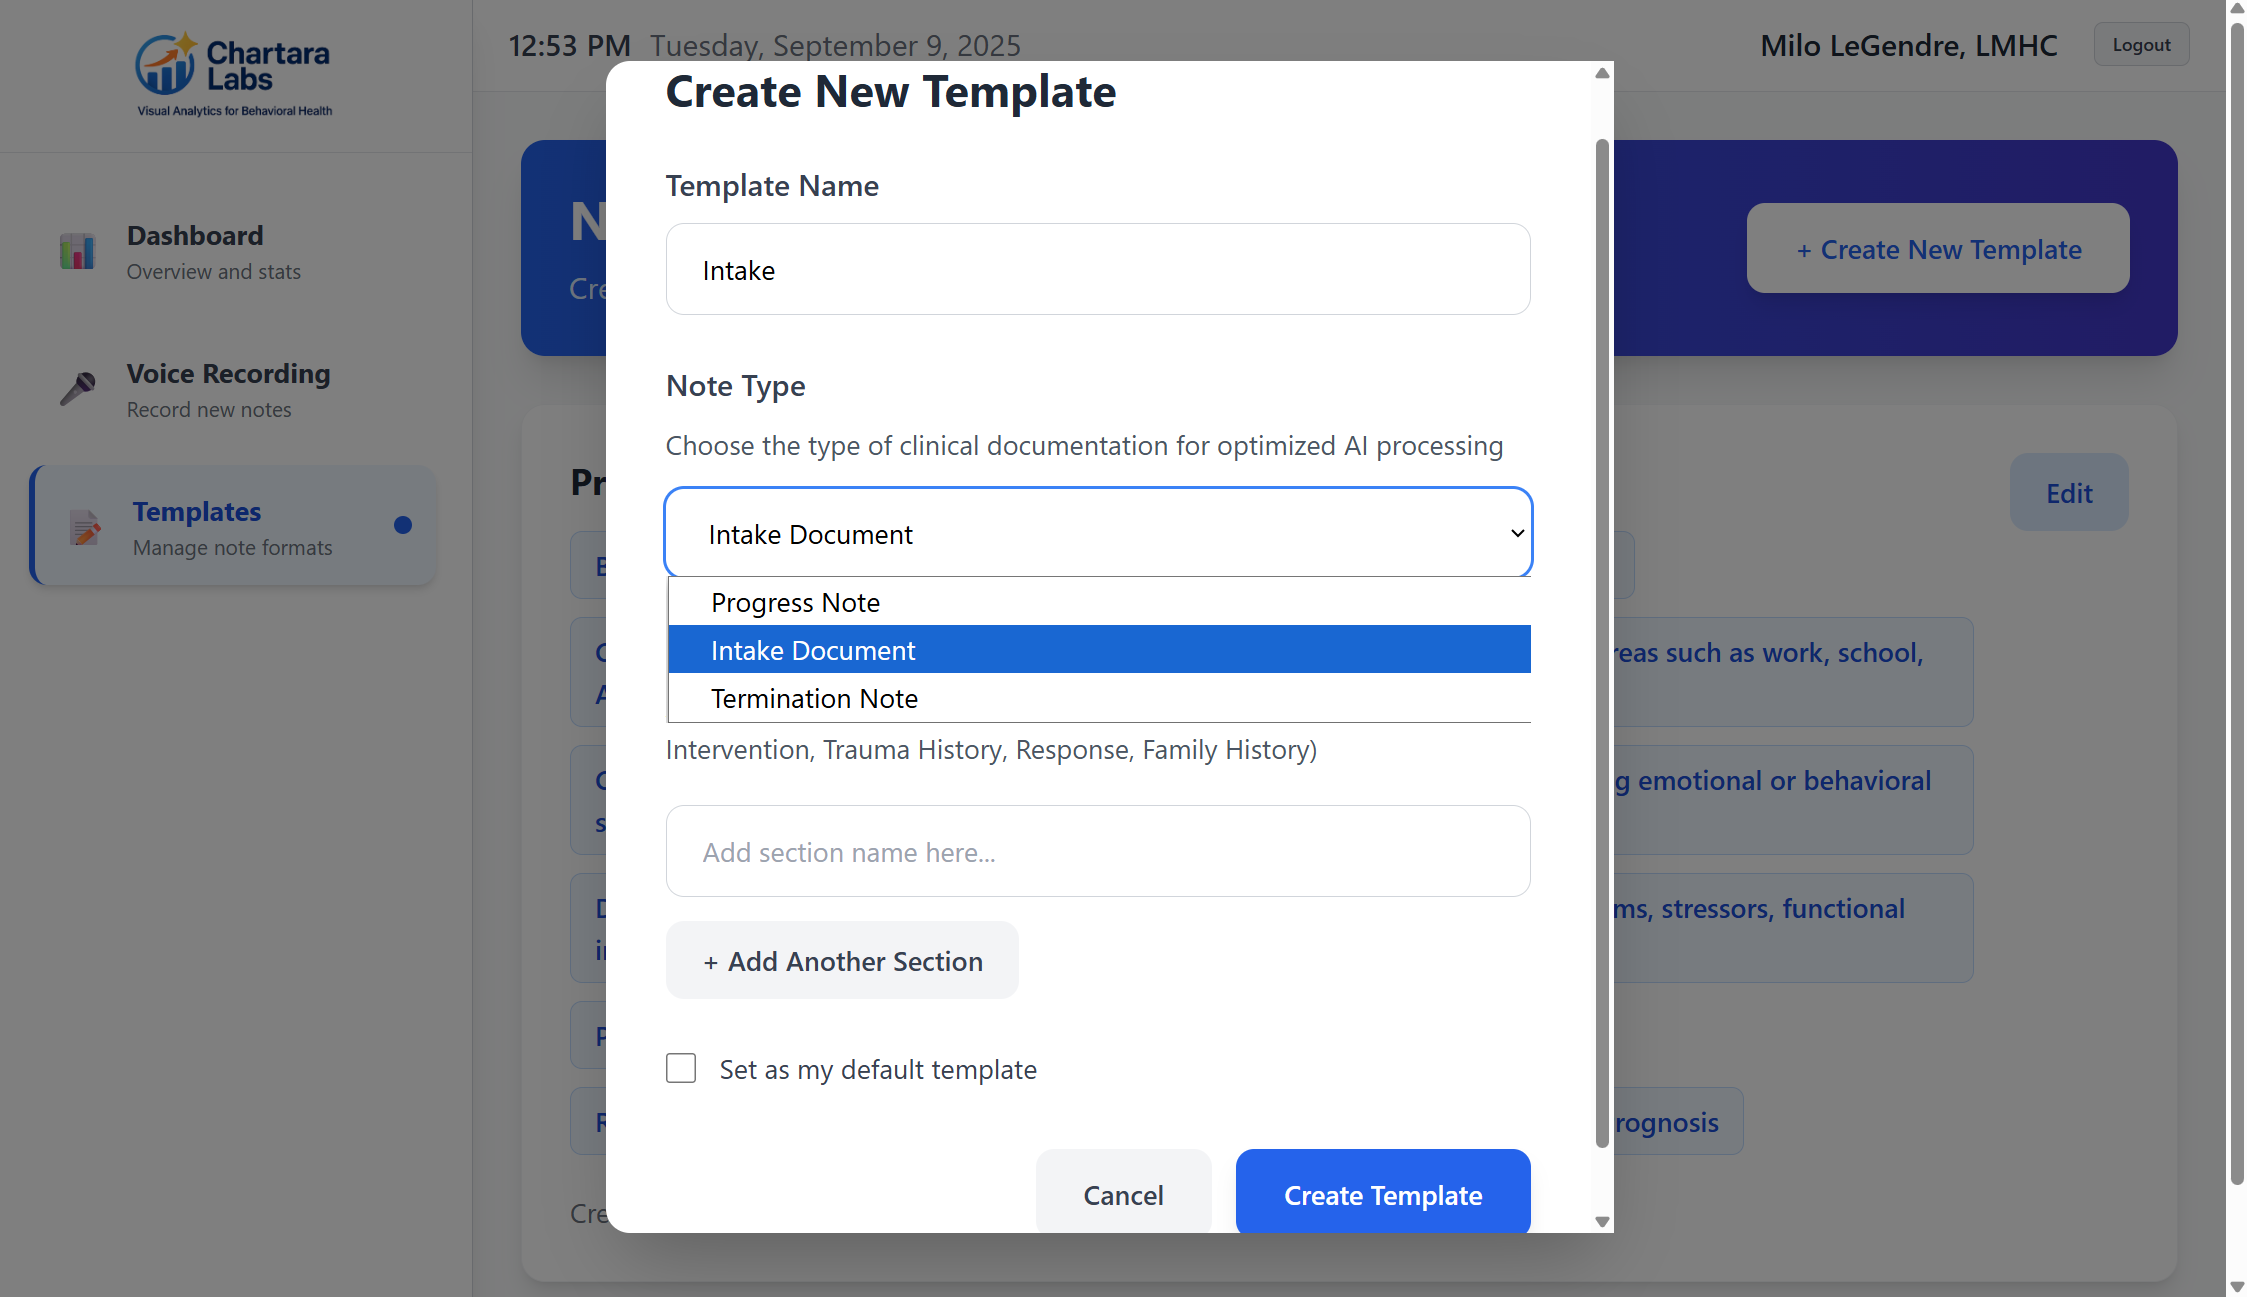
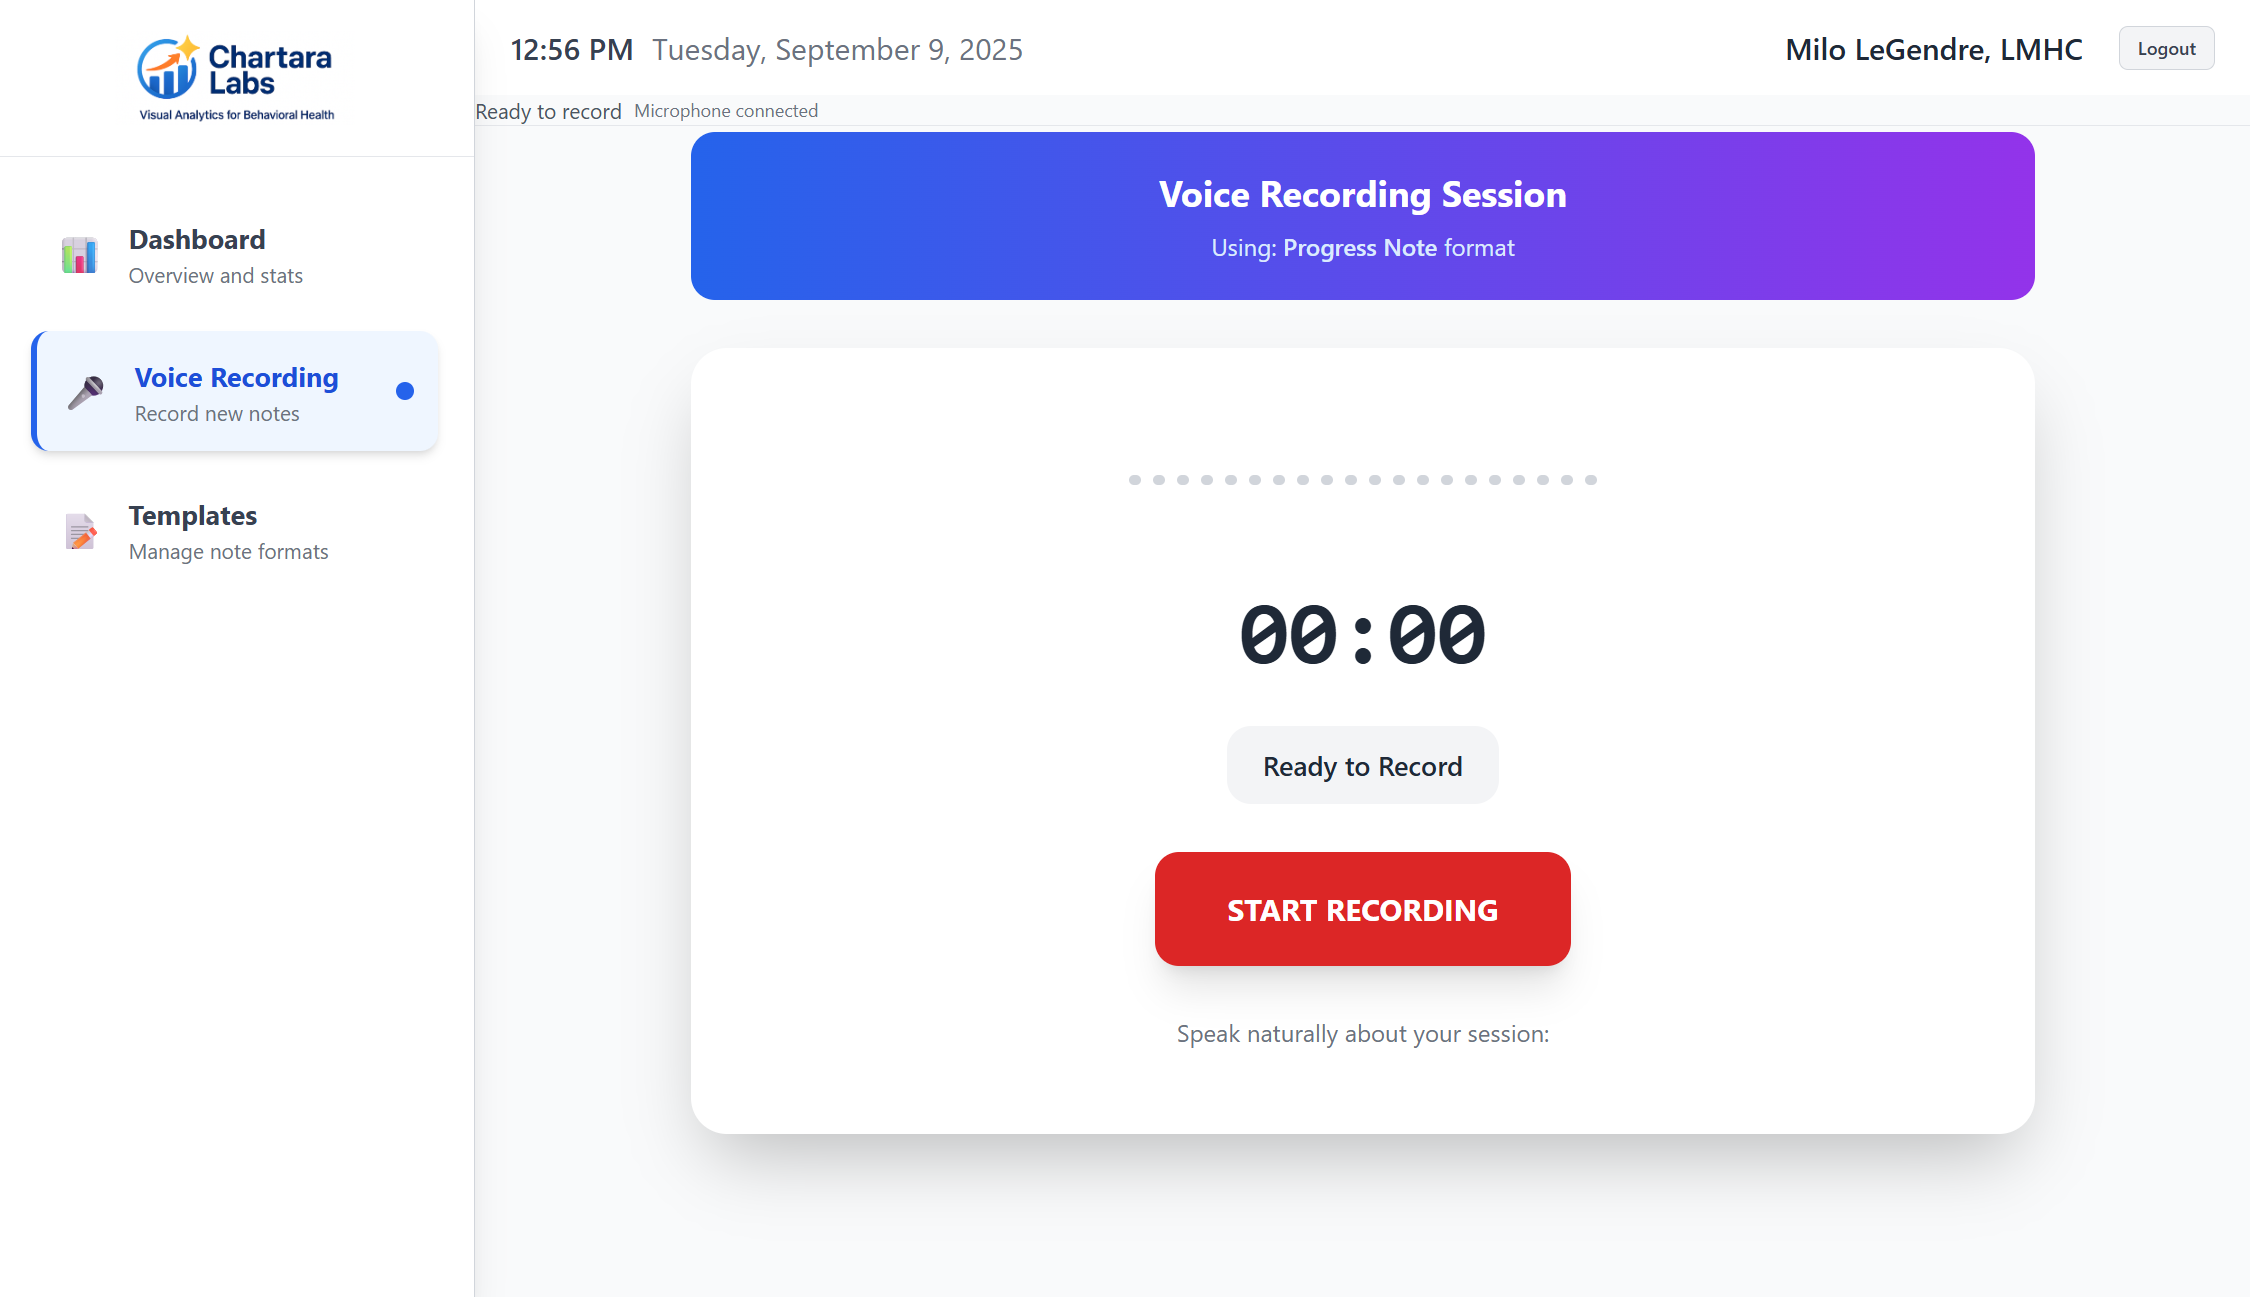
Chartara Notes
Create professional clinical documentation by simply speaking about your sessions. Chartara Notes adapts to YOUR workflow - build custom templates with your exact section headings, or use proven formats like SOAP and DAP. Our AI understands therapeutic language and intelligently transforms your natural speech into polished, HIPAA-compliant notes in seconds. Stop typing for 30 minutes. Start speaking for 60 seconds.
Set and save your templates for ANY documentation format. Intake. Session Note. Termination Summary etc.
Chartara Labs Essential Practice
Complete AI-powered visual analytics platform with comprehensive chart library, PDF reporting, and intelligent business insights specifically designed for behavioral health practices.
Lightweight Add-On to Your Existing EMR
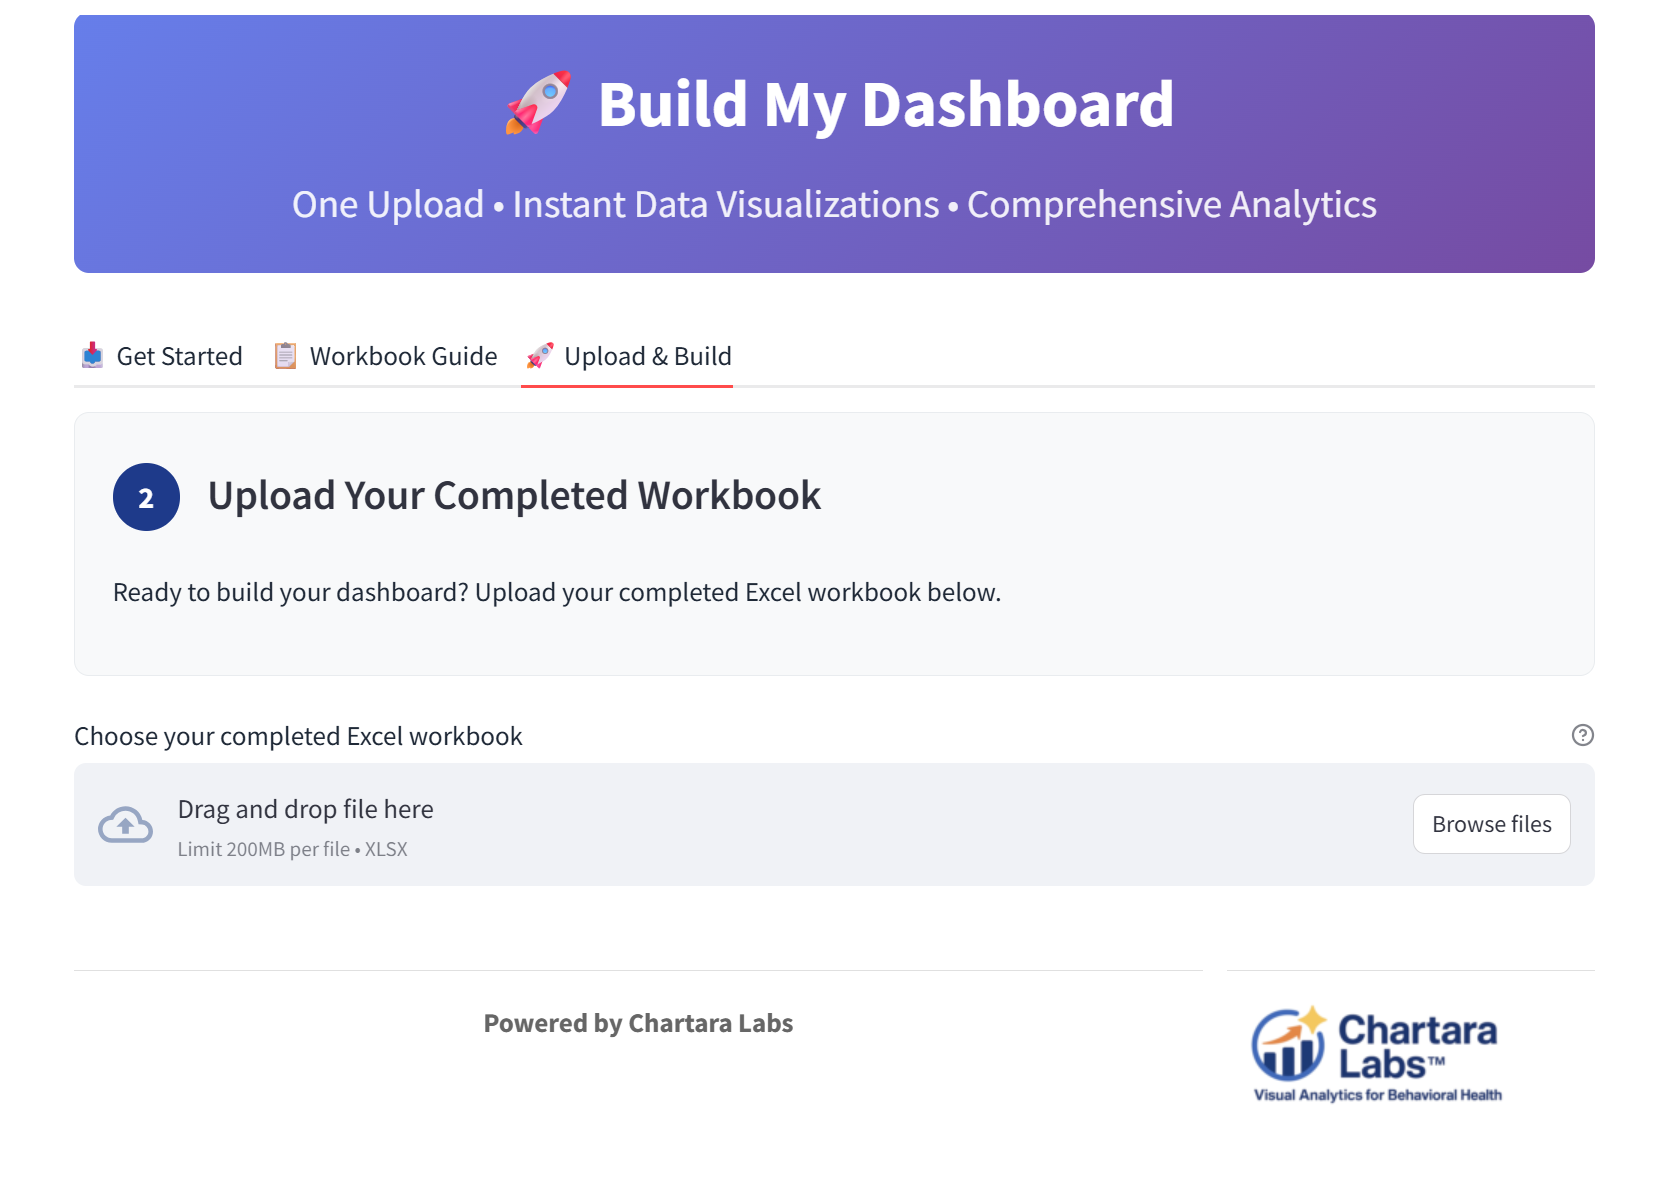
Use the Chartara Master Excel Workbook
Chartara Labs provides a Master Excel Workbook downloadable in "Build My Dashboard". Customize your data according to your specific needs. Integrate the Chartara Master Excel Workbook into your workflow to enhance your supervision, outcome tracking, and/or business intelligence capabilities.
Workbook Guide
Use the simple Workbook Guide in "Build My Dashboard" to understand the tabs on the bottom of the Excel file. Each tab powers a specific chart.
Upload Your File
Only enter the data you have or need. You do not need to fill out the whole Excel workbook. The software features a date tagged "Use Last Uploaded" button. You do not need to upload a new file every time you login. Instantly upon upload, visual analytics are generated based on your specific data and the chart tabs you filled out. Navigate to the specific charts to view your results.
Comprehensive Chart Library
📊 Business Intelligence
- Revenue by CPT Code
- Income by Month
- Caseload Breakdown by Diagnosis
- Treatment Months by Insurance Type
🧠 Clinical Monitoring
- Treatment Plan Review Tracker
- PHQ-9 Scores (Clients with Any Score)
- GAD-7 Scores (Clients with Any Score)
- Risk Level Distribution
- Individual Client PHQ-9 Tracker
- Individual Client GAD-7 Tracker
👥 Demographics & Attendance
- Client Distribution by Age, Race, and Sex
- Client Attendance by Session Type
- Attendance by Age and Sex
- No Show Percentage by Client
Choose Your Plan
Essential Practice
- Numerous AI-powered visualization charts
- Automated Colored PDF Report Generation for Every Chart
- Revenue forecasting with intelligent algorithms
- Add team members and manage multiple seats
- Email invitations for team member access
- HIPAA-compliant cloud storage
- Simple Practice data export compatibility
- Mobile browser compatible - works on iPhone, Android & tablets
- No-show prediction and risk assessment
- PHQ-9 & GAD-7 outcome tracking with ML predictions
- Regular product updates with new charts at no additional cost
- Unlimited data uploads and chart generation
- Email support and documentation
Custom Integration Bundle
- Everything in Essential Practice
- Bundle all services together in one unified interface
- Chartara Train + Chartara Sync + Chartara Notes integration
- Custom data visualization development
- Organization-specific analytics and workflows
- Advanced team-oriented features and permissions
- Direct consultation with clinical technologist
- Tailored implementation and comprehensive training
- Priority support and dedicated account management
- Seamless single sign-on across all modules
Meet the Founder: Milo LeGendre, LMHC
Milo LeGendre, LMHC is a thought leader and trailblazer in behavioral healthcare, pioneering the integration of artificial intelligence and visual analytics to transform clinical practice. As a Licensed Mental Health Counselor and current PhD student at National University studying Psychology, Social Policy, and Behavioral Health Administration, Milo combines hands-on clinical expertise with cutting-edge research to address one of healthcare's most pressing challenges: making data actionable for practicing clinicians.
The Research Foundation
During his doctoral studies, Milo immersed himself in the growing body of evidence highlighting critical gaps in behavioral health practice. His research revealed a troubling disconnect: while systematic reviews by Lloyd et al. (2019) demonstrated that routine outcome monitoring and feedback on client progress are associated with positive treatment outcomes, many therapists struggle to engage meaningfully with client data in ways that inform treatment decisions.
The problem wasn't lack of data—it was accessibility and interpretation. Milo understands that therapists are often overwhelmed by well-intentioned data sets that are essentially numbers on a computer screen, siloed in different compartments of vast electronic medical records. Research by Azizian Kia et al. (2024) confirmed that therapists are more likely to engage with data presented in clinically meaningful, visually intuitive formats conducive to self-reflection.
This convergence of evidence pointed to a clear solution need: data visualization that leverages human visual processing capabilities to decrease cognitive load and speed up decision making (Parikh et al., 2021). Inspired by how the scholarly literature was clicking for him, Milo wanted to find a way to combine his clinical expertise, technology, and data science to solve problems he experienced in the field, and learned more about through his doctoral studies.
The Clinical Innovation Journey
Drawing from his on-the-job clinical experience, Milo began experimenting with technology to bridge this research-practice gap. As he piloted visualization tools using de-identified client data from his caseload, he experienced what he describes as "a transformative form of routine outcome monitoring." Visualizing patterns in client PHQ-9 scores and attendance data allowed him to identify when interventions coincided with symptom improvements—and critically, when they did not.
The "Internal Call to Action"
This process created what Milo calls an "internal call to action"—visualized data sparked deeper clinical inquiry about treatment adjustments, therapeutic alliance factors, and evidence-based practice fidelity. Rather than data collection being a procedural task, interacting with visualizations fostered deliberate clinical reflection and adaptation, directly addressing the implementation barriers identified in his research. Milo believes that data-visualization in behavioral health creates a "motivating experience" within clinicians. He feels that if therapists engage with visualized caseload data, it will increase the likelihood of them to make necessary adjustments to their treatment strategies, more effectively engage in routine outcome monitoring, and adhere to evidence based treatments.
Innovation Through Research
Chartara Labs represents a novel approach to clinical decision support that synthesizes Milo's research findings into practical solutions. The platform addresses the core challenge identified by Lloyd et al. (2019): transforming routine outcome monitoring from overwhelming data dumps into accessible clinical insights. As Milo discovered in his research, the integration of clinical decision support with data visualization represents a methodological innovation that transforms complex information into intuitive formats that highlight otherwise hidden patterns (Parikh et al., 2021).
Mission: Democratizing Data-Driven Therapy
Recognizing the transformative impact these tools had on his own practice, Milo founded Chartara Labs to disseminate these innovations to clinicians nationwide. Chartara Labs emerged from Milo's recognition that the future of mental health care lies in minimizing friction and maximizing insight—turning raw data into centralized, easily interpreted visuals that empower therapists and clinical supervisors to make truly data-driven decisions.
References:
Azizian Kia, S., Wittkampf, L., van Lankeren, J., & Janse, P. (2024). Motives of therapists for using routine outcome monitoring (ROM) and how it is used by them in clinical practice: Two qualitative studies. Administration and Policy in Mental Health and Mental Health Services Research, 52(2), 159–170.
Lloyd, C. E. M., Duncan, C., & Cooper, M. (2019). Goal measures for psychotherapy: A systematic review of self‐report, idiographic instruments. Clinical Psychology: Science and Practice, 26(3), Article e12281.
Parikh, N., Daughton, A., Rosenberger, W., Aberle, D., Chitanvis, M., Altherr, F., Velappan, N., Fairchild, G., & Deshpande, A. (2021). Improving detection of disease re-emergence using a web-based tool (RED Alert): Design and case analysis study. JMIR Public Health and Surveillance, 7(1), e24132.

Get in Touch
Have questions about Chartara Labs? Want to discuss custom solutions for your organization?
We're here to help you transform your practice with AI-powered analytics.
support@chartaralabs.ioReach out to us with any questions about implementation, pricing, or custom development needs.